Overview
Refinery in Asia, with a capacity 400,000+ bbl/d.
The client wanted to reduce their maintenance activities and costs but didn’t know how to safely go about this. They had 20 years of failure data for sensors and valves, and the datashowed that on average 75% of the replacements were correctivereplacements, and 25% of the replacements were preventive. The financial optimisation of the assets depends on risks and maintenance costs, and to be able to include all the specific characteristics regarding maintenance and risks.
Two typical refinery assets were selected in this project, i.e. a distillation column and a storage tank. In general, three maintenance strategies can be identified as;
- Corrective maintenance (CM)
- Preventative maintenance (PM)
- Predictive maintenance (PdM)
Corrective maintenance is also known as ‘run to fail’. Preventive maintenance uses redetermined
arbitrary time replacements intervals, usually based on experience. Predictive maintenance determines the optimum replacement interval based on historical failure data.
How we helped
The goal was to recommend the optimum maintenance strategy, whether that be CM, PM or PdM and the frequency from the different sensor and valves that are part of a storage tank and istillation column at the refinery. To predict this, we determined the optimum maintenance strategy for each component (sensor or valve), by minimising the summarised costs for both risk (production losses, safetyand environmental consequences) and maintenance.
Risk = probability of failure, x consequence of failure.
The probability of failure was determined by analysing 20 years of failure data, using the Weibull distribution. This analysis provided the Mean Time to Failure, which can be used to determine the probability of failure at any given age of the analysed sensor or valve. The benefit of using failure data over data from a database is a more accurate Mean Time to Failure (MTTF).
An Failure Mode Effect and Criticality Analysis provided the consequences of failure for each component, in the selected distillation column and storage tank. Subsequently the consequences are quantified in a monetary value and multiplied with the probability of failure to obtain the risk of failure of each component.
Expressing the consequence of failure in a monetary value was identified as the best way to truly minimise the risk for our client and society, as expressing the probability and consequence of failure in an arbitrary ranking leaves too much room for interpretation.
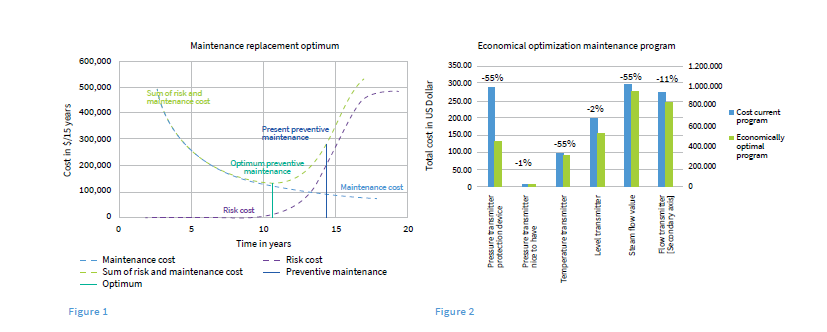
The results from the optimisation are displayed in figure 1.
When the replacement interval for the pressure transmitter is increased, the probability of failure increases as does risk. When using corrective maintenance, on average the component is replaced at the MTTF. Applying this optimum frequency saved the client a significant amount of money over the life time of the pressure transmitter.
The impact
The financially optimal maintenance strategy requires replacement of the sensors and valve years before the MTTF is reached, because the risk of failure is too high.
Figure 2 displays the reduction in costs for maintenance and expected risk for the client. For the six assets analysed in this project, an average reduction of 15-20% was reached by optimisating the maintenance strategy and balancing risk withmaintenance cost.

Benefits
- Reduction in costs in maintenance
- Reduction in expected risk
- In the case of the Critical Pressure Transmitter, the total of maintenance cost and expected risk is reduced by up to 55%.
Key services and solutions
Here are links to some of the services and solutions that came together to deliver the project.